ECONOMY-WIDE MODELLING. FUEL TAX AND DEVELOPMENT.
Economy-wide models are useful tools for investigating the effects of policies with direct or indirect shock-like repercussions within an economy. Models are based on economic theories and supported by data analytics. The model draws from macroeconomic and sector national accounts data, supply-use tables and institutional data organized in a social accounting matrix format, and are informed by empirically derived behavioural rules for consumers, producers, investors and governments.
Informing Development Policies
The Fuel Tax and Development visualization was designed to illustrate the trade-offs and potential synergies involved in an important sustainable development policy: Introducing a tax on fuel as a proxy for carbon tax (see publication).
The illustration hinges on the question of how the newly generated tax revenue is spent or recycled back into the economy, e.g. applying the new revenue to a simple expansion of initial budget, to expenditures in education, or to infrastructural investment.
Modelling Strategy
The analysis starts by estimating a reference/base scenario. This is defined as an scenario where the economy of each country grows at a constant rate of 4 to 7 percent, preserving the same macro-stance and the same sector composition as in the initial year.
Then policy scenarios introduce the fuel tax (a proxy for a carbon-tax) following the yearly schedule needed to achieve the 2 percent points of GDP by 2030. For each year the model calculates a new equilibrium including the direct or indirect effects of the policy. This “new” state of the economy is used, together with other factors such as population growth and new capital stock, to estimate next year’s starting state of the economy (i.e. recursively). In all policy scenarios, the economy maintains the same ratio of public budget deficit to GDP as in the reference scenario.
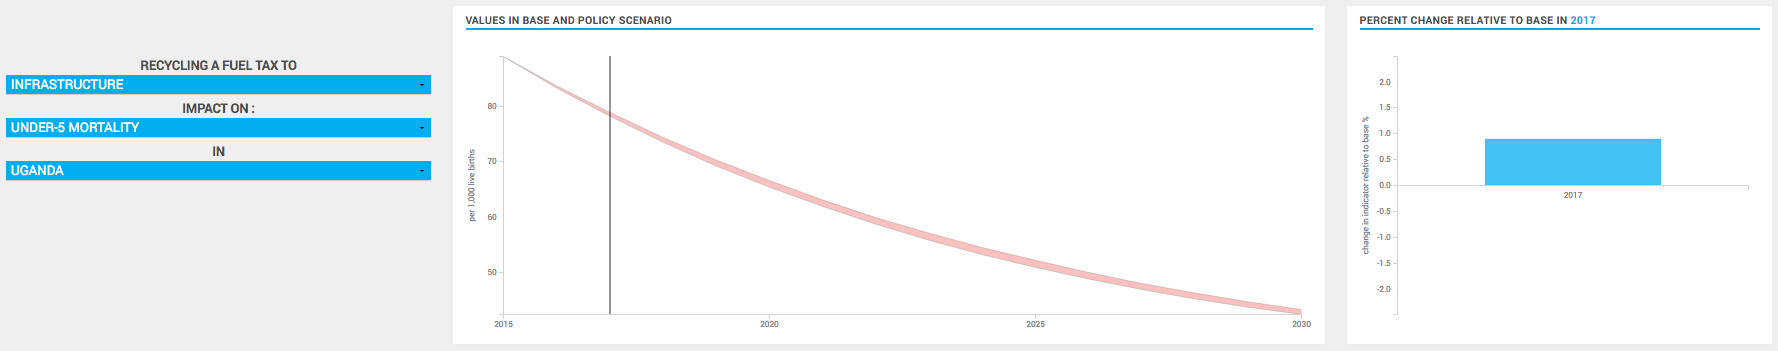
The values of the selected impact indicators in the base and policy scenario of choice are displayed in a time series plot and for the selected year the simulation percent change relative to base is shown on a bar plot (right).
Visualising Results
This visualisation features four policy scenarios and six impact indicators/variables.
Scenarios
| Budget expansion proportionally directs new revenue to all budget lines. |
| Infrastructure directs new revenue to public infrastructure |
| Primary education directs new revenue to primary education |
| All education directs new revenue proportionally to all education levels |
Impact Variables
| Primary completion rate (% of cohort) |
| Under-five mortality rate (per 1,000 live births) |
| Maternal mortality (per 100,000 live birds) |
| Drinking water (% of population) |
| Basic sanitation (% of population) |
| Real GDP (millions >>>> --at factor prices) |
Insights
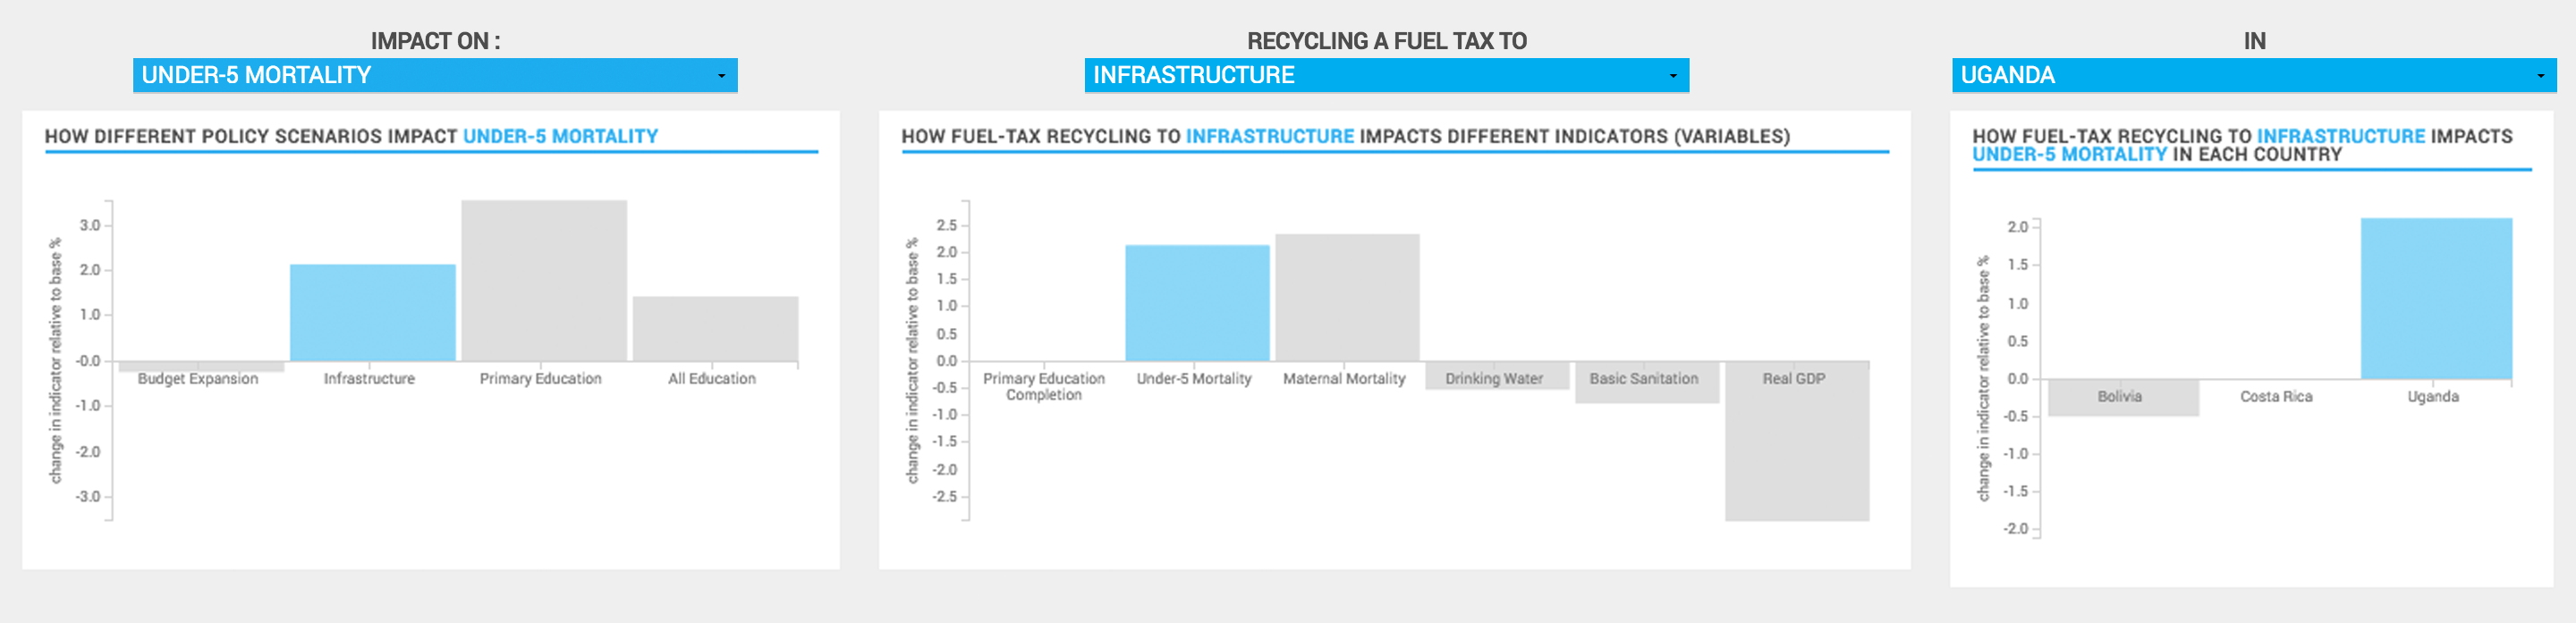
For each selected year, the visualisation looks at the impact of the policy scenario on the selected indicator as a percent change relative to the value in the base scenario. To give a sense of trade-offs and synergies, the same percent change between the policy and the base scenario can be seen from three different perspectives in the three lower plots.
Looking at 2030, recycling the fuel tax to infrastructure investment in Uganda worsens all social indicators and GDP, but leaves primary education unchanged.
Looking at 2030, recycling the fuel tax to infrastructure or education has the unwelcoming effect of raising infant mortality in Uganda, but if the tax is recycled to all budget lines infant mortality actually decreases.
Looking at 2030, the same fuel tax recycling to infrastructure investment that has the effect of raising infant mortality in Uganda, has the welcoming effect of reducing it in Bolivia, and leaving unaffected in Costa Rica.