Universal Access to Electricity
The 2030 Agenda has set the goal of universal access to electricity by 2030. The challenge is significant. It involves reaching population with limited incomes, often living in sparsely populated areas, mostly in developing and least developed countries. Costs can tally. Taking into account local characteristics, this model finds the combination of technologies that can provide universal access to the population of every country at the lowest cost.
Visualizing Electrification Modelling Results
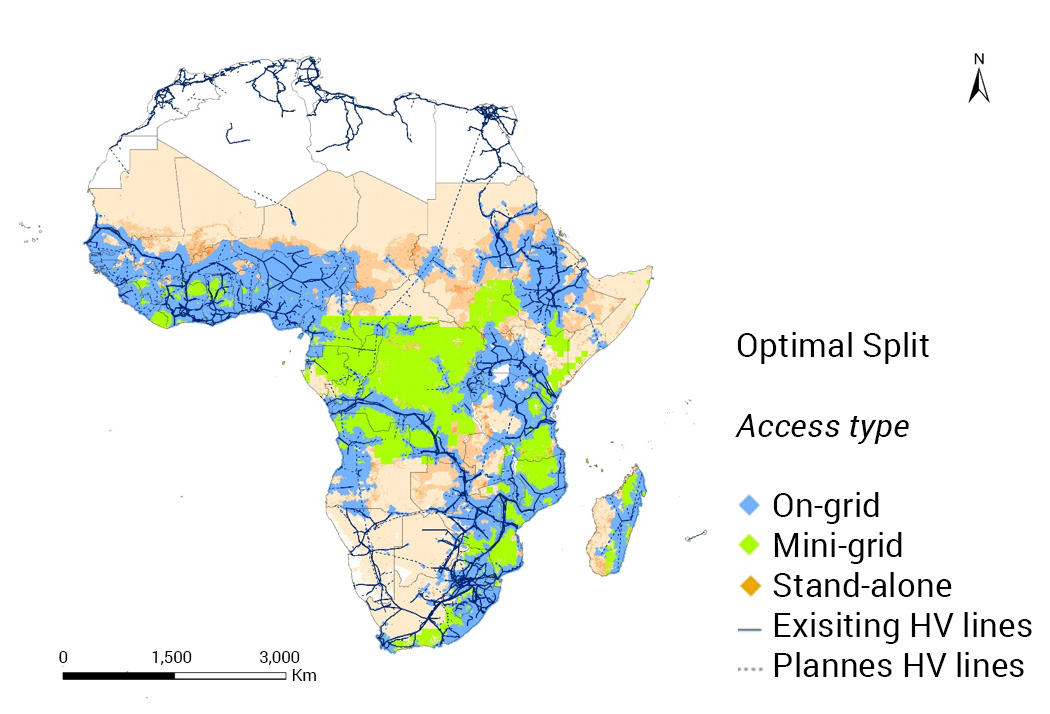
The visualisation tool allows for further exploration of model results. It displays country maps showing the choice of technology –Grid, Mini-Grid, and Stand alone energy devices—for each locality of 10 by 10 kilometres, assuming five different per capita consumption levels and two diesel prices.
To ease visualisation, the six technologies currently considered are aggregated to three technology types --GRID, Mini-Grid, and Stand alone, and plotted in a country or region map.
Universal Access
The model finds, using open geospatial data, which technologies provides electricity at the lowest cost to the population living in each 10 by 10 kilometers area in countries. The target population in each country is defined as the 2030 population minus the 2012 population without access to electricity. The national growth rate is then applied to the 2012 population geospatial data for each 10 by 10 kilometres in countries.
The model makes choices on the levellized cost of technologies calculated based on locally adjusted technical data such as distance to grid, distance to diesel sourcing, solar radiation, wind factors, water availability, among others. In granting universal access to electricity the model considers grid and off-grid options, five per-capita electricity consumption levels and two diesel prices. the model decides on the least costly option after comparing the costs of connecting to the central grid, to a mini grid, or to stand-alone solutions.
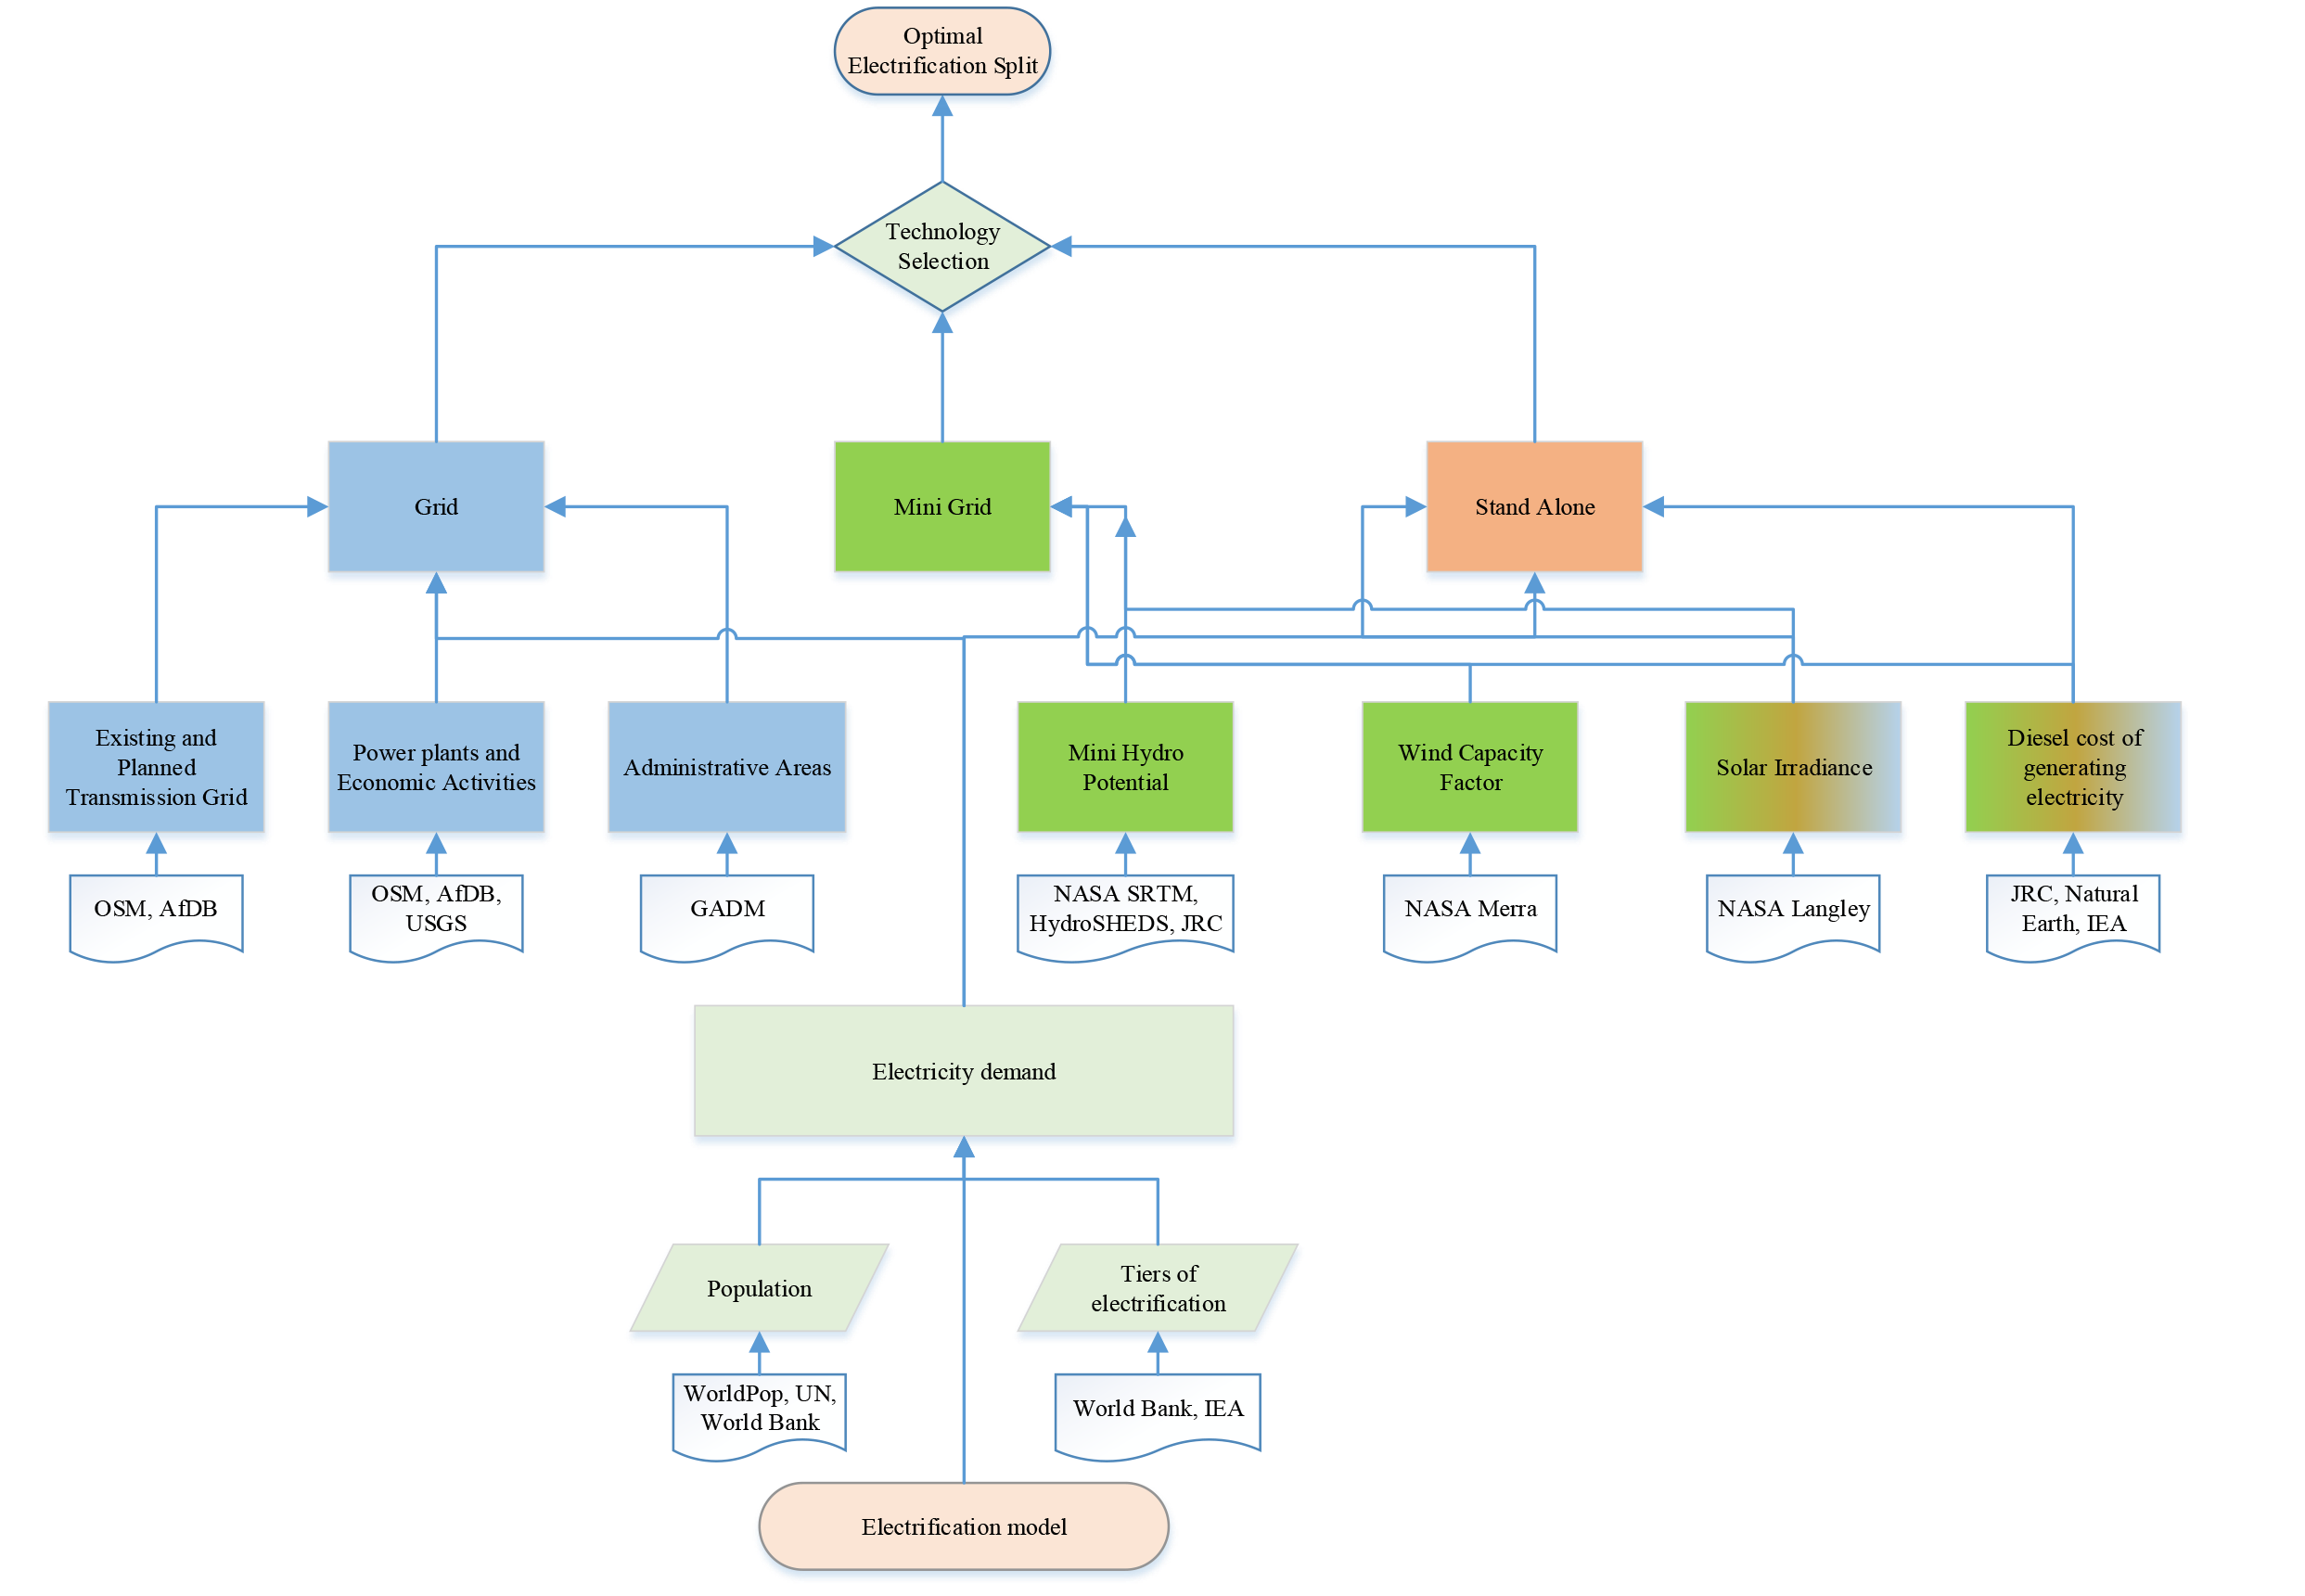
Technologies
The model currently considers six technologies groups in three types:
Grid
The national interconnected network: distribution and transmission lines, as well as power generating stations, e.g. fossil fuel or geo thermal, hydro, and other plants.
Mini Grid
Mini grids are (relatively) small networks that generate and distribute electricity to villages or neighborhoods. Mini-grids are powered by diesel, wind or solar technologies (mini-hydro plants will soon be added to the model).
Stand alone
Stand alone solutions refer to the provision of electricity using technologies appropriate for single users, e.g. households and small businesses. These include solar photovoltaic panels and diesel generators.
Scenarios
The modelling is done for 10 alternative scenarios defined by 5 indicative quantities of electricity consumption and two diesel prices.
The first indicative consumption provides approximately 20 kWh per household per year while the fifth provides 2,195 kWh. Indicatively, in the first scenario households can only have task-lighting and recharging a cell phone or a radio; in the fifth households have enough electricity to enjoy general lighting and continuous use of heavy appliances, such as refrigeration, air conditioning and eventually cooking. From first to fifth, scenarios increase available amounts of electricity incrementally. A household size of 5 is assumed thoroughly.
| Indicative services made possible by specified kilowatts of electricity |
Task lightning + phone charging or radio |
Tier 1 + General lightning + air circulation + television |
Tier 2 + Light appliances |
Tier 3 + Medium or continuous applicances |
Tier 4 + Heavy or continuous applicances |
| Level of Access | Tier-1 | Tier-2 | Tier-3 | Tier-4 | Tier-5 |
|---|---|---|---|---|---|
| Consumption per Household per Person | |||||
The model assumes two international diesel prices, 0.32 US$/liter and 0.70 US$/liter, used to calculate diesel costs in different localities. These, when crossed with household consumption levels, generate 10 scenarios of electrification for each country or region.
| Diesel Level | Price |
|---|---|
| High | 0.70 US$/liter |
| Low | 0.32 US$/liter |
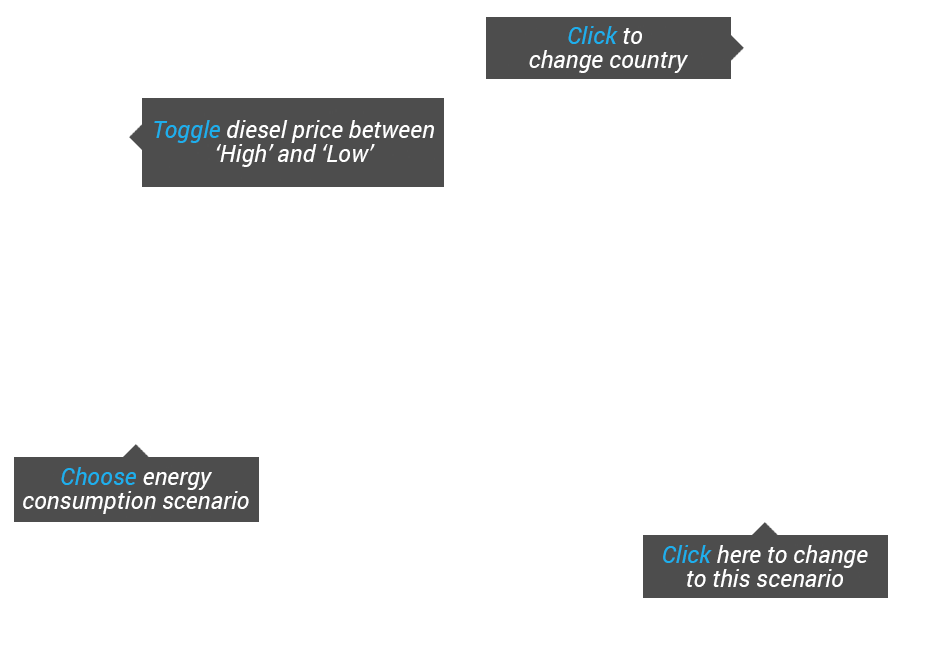
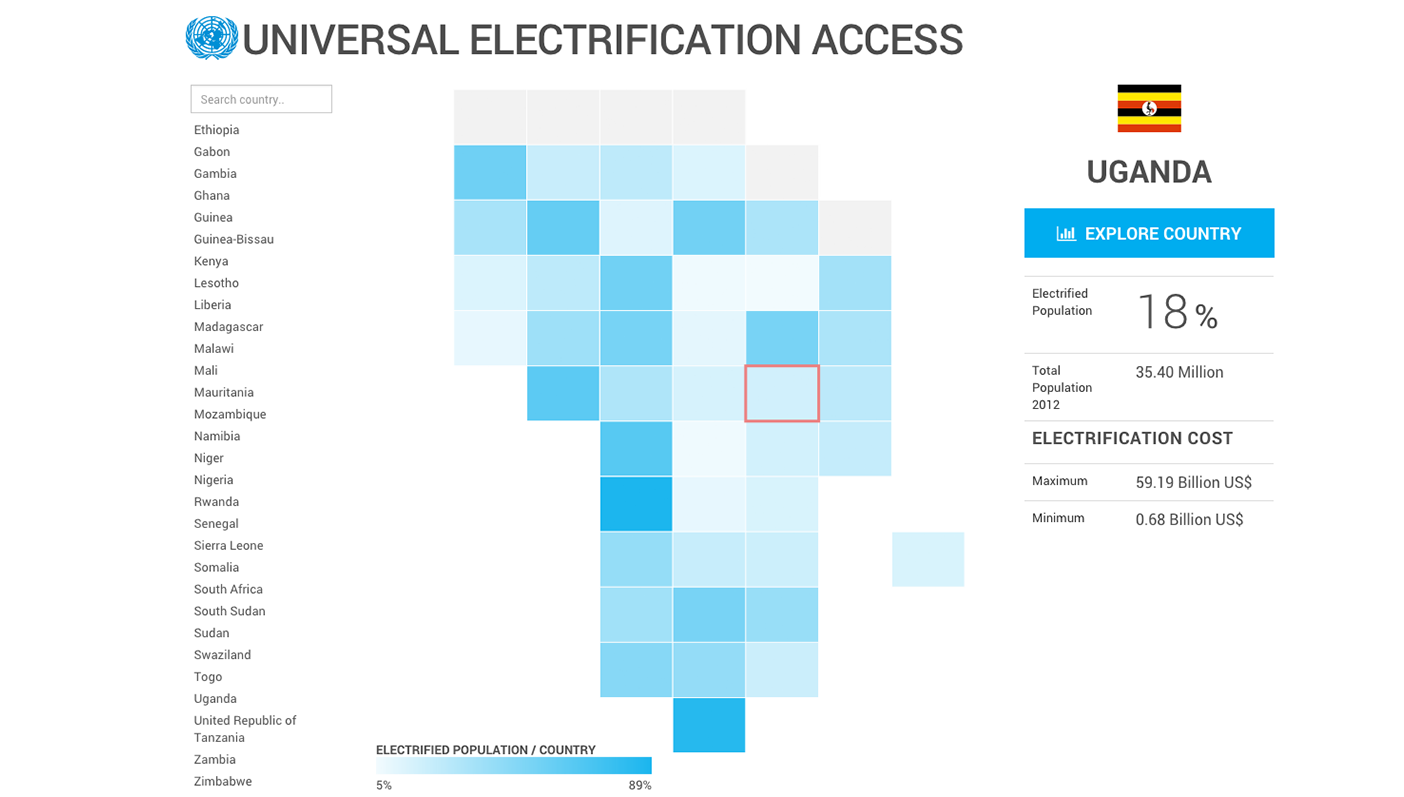
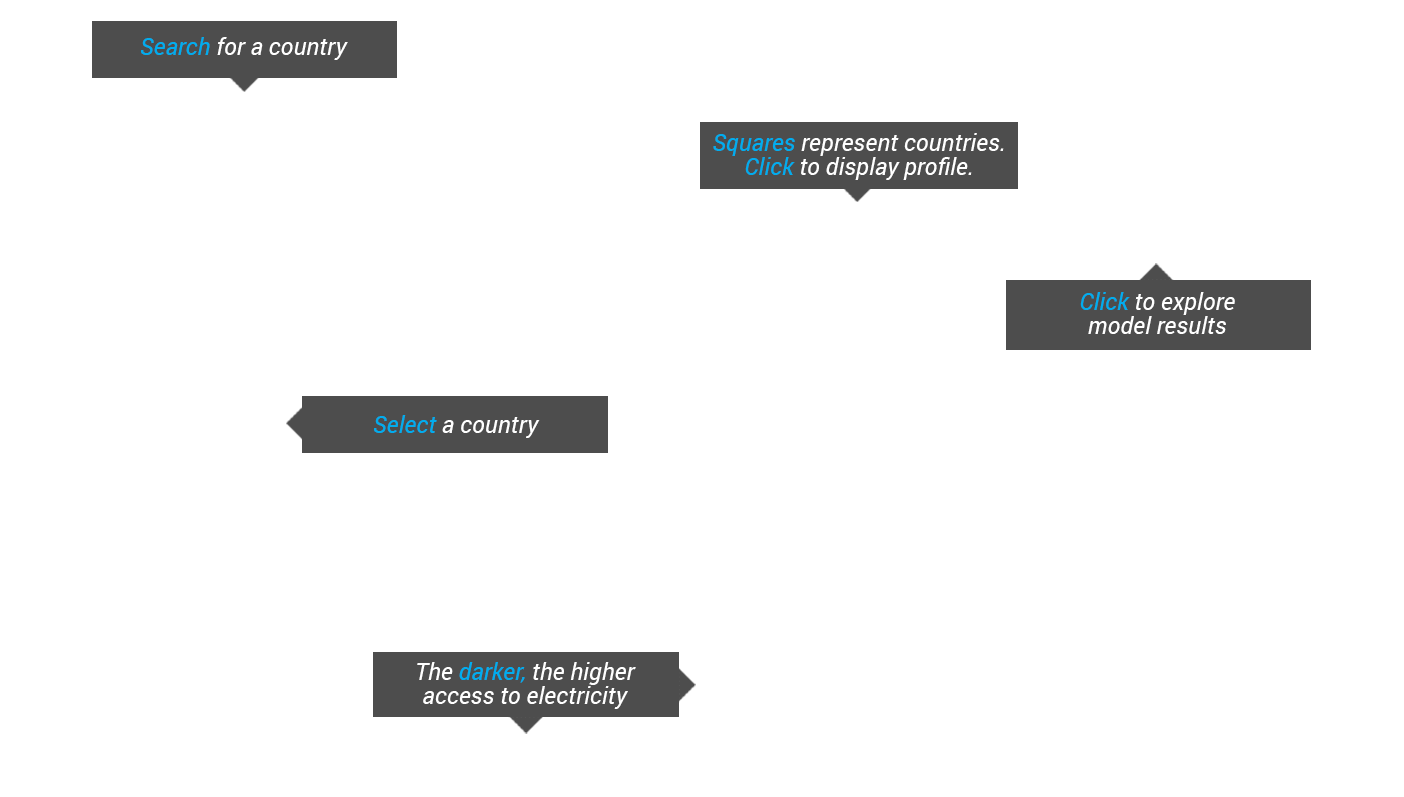
How to Use this Tool
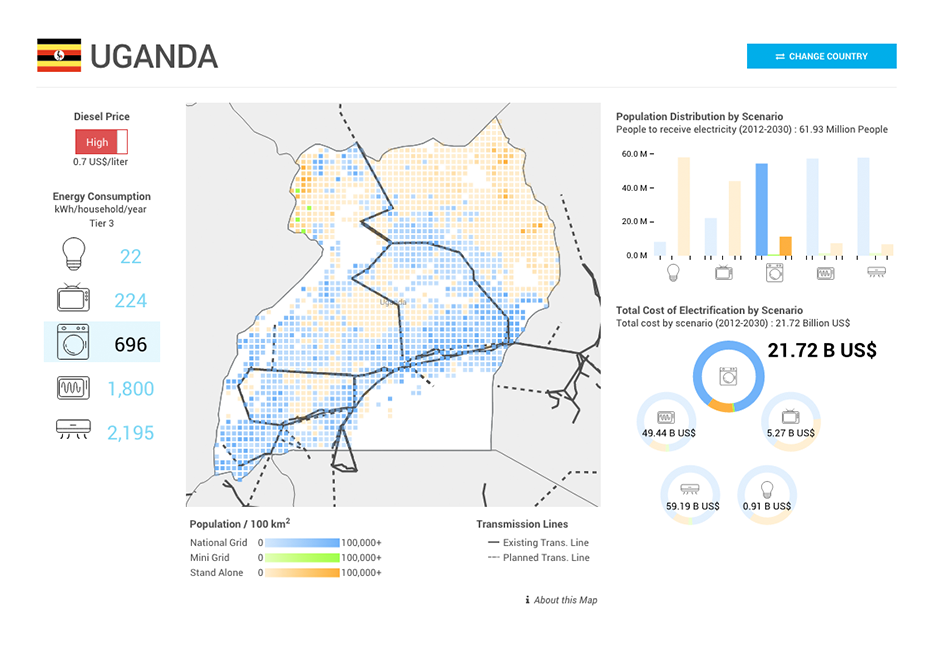
The visualization allows the selection of countries from ad dropdown menu or by clicking on the chosen country in a map. Once in a country page, the visualization displays buttons to select one of the two diesel prices and one of the electricity consumption levels or tiers. It shows a map of the selected country with the mesh of 10-by-10 kilometres localities. A bar chart and a doughnut graph.
Each country map shows the following:
- Existing and planned electricity lines (reference year is 2012)
- The mesh of ten-by-ten kilometres areas coloured according to the type of technology
- The opacity of each of the ten-by-ten localities represents the number of people estimated to live in 2030 in that locality, the darker the colour the more people live in the area
- An opacity bar indicating the number of people corresponding to the opacity of the mesh.
How to Use this Tool
The bar chart displays, for a given price of diesel, the number of people to receive electricity by each of the three types of technologies, e.g. Grid, Mini-Grid and Staalone. The sum of the number of people in the three bars is the population that must receive electricity between 2012 and 2030 if universal access is to be achieved. This number does not change, of course, from one scenario to another nor with changes in the number of people to be served by each technology.
The doughnut plot shows the distributions by technology of the total investment cost needed to achieve by universal access. The total investment cost is displayed next to the graph, and it does normally change with scenario and combination of technologies.
See the code of the model, data, and other supplementary material in this link.